Oklahoma Water Well Report Extraction Pipeline
I built a Python/Jupyter pipeline to pull groundwater data from 144,644 linked public well reports, check the results, and deliver clean Excel and CSV files with a workflow for quarterly updates.
The problem
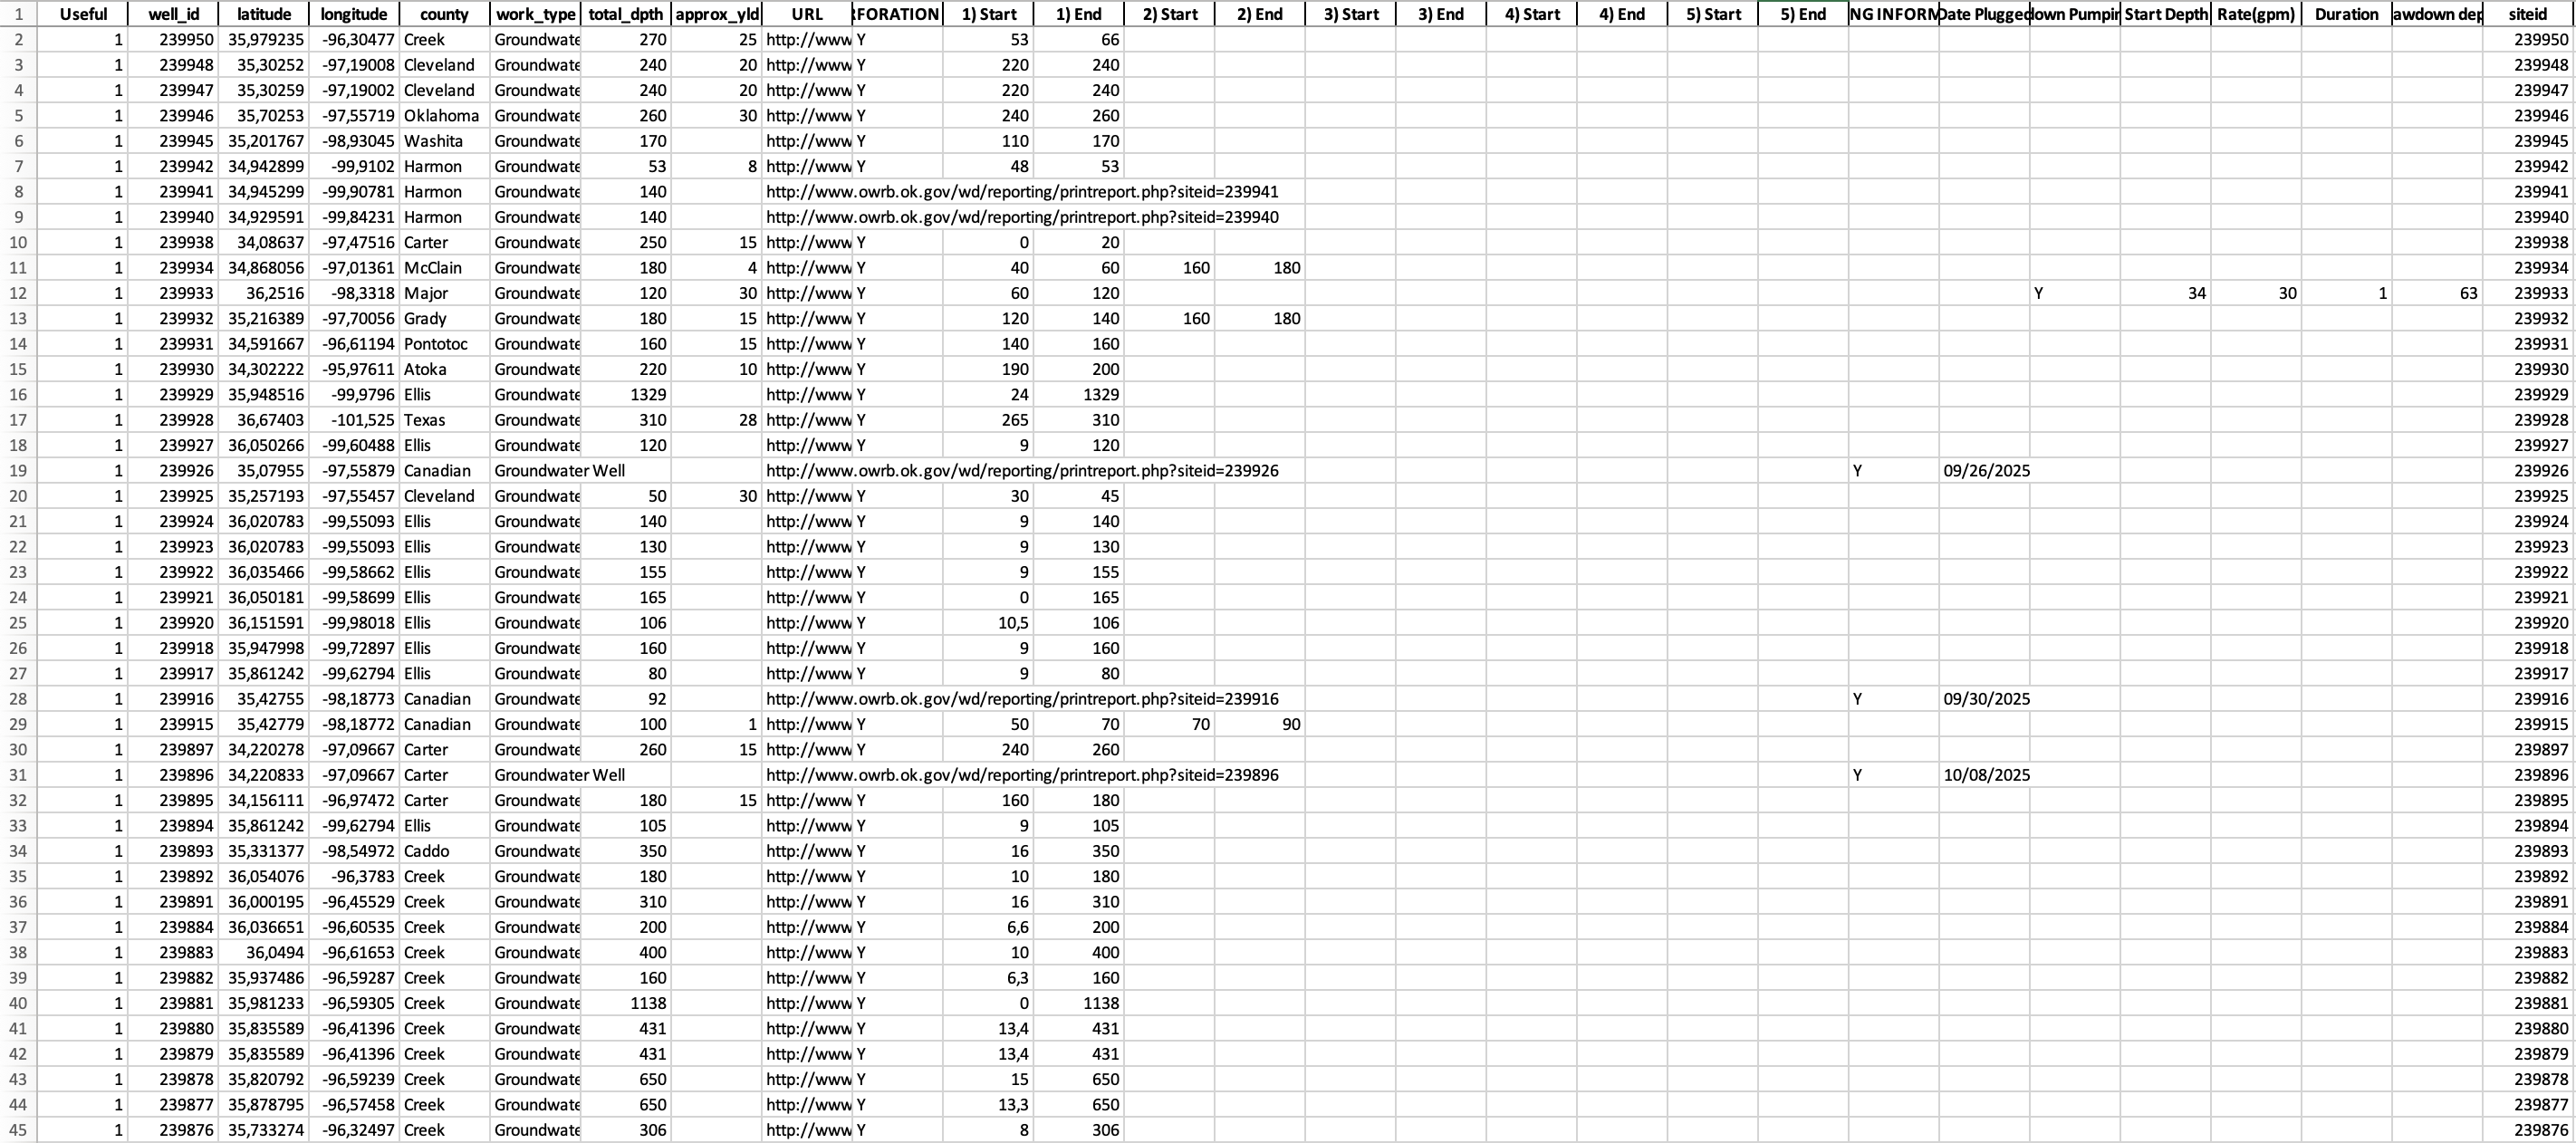
A water-data client needed information from Oklahoma public well records for mapping and downstream analysis. The state dataset included one row per well and a link to the corresponding report, but several useful groundwater fields were only available inside those individual report pages.
Public data source: https://home-owrb.opendata.arcgis.com/datasets/OWRB::reported-well-logs/explore?location=35.327300%2C-98.722350%2C6&showTable=true
Example report: https://www.owrb.ok.gov/wd/reporting/printreport.php?siteid=239933
Opening more than 144,000 reports by hand was not workable. The client needed a reliable way to extract the data now and process new records as they appeared in future state releases.
Core challenge: turn a manual, report-by-report lookup process into a repeatable extraction and QA workflow.
Pipeline Overview
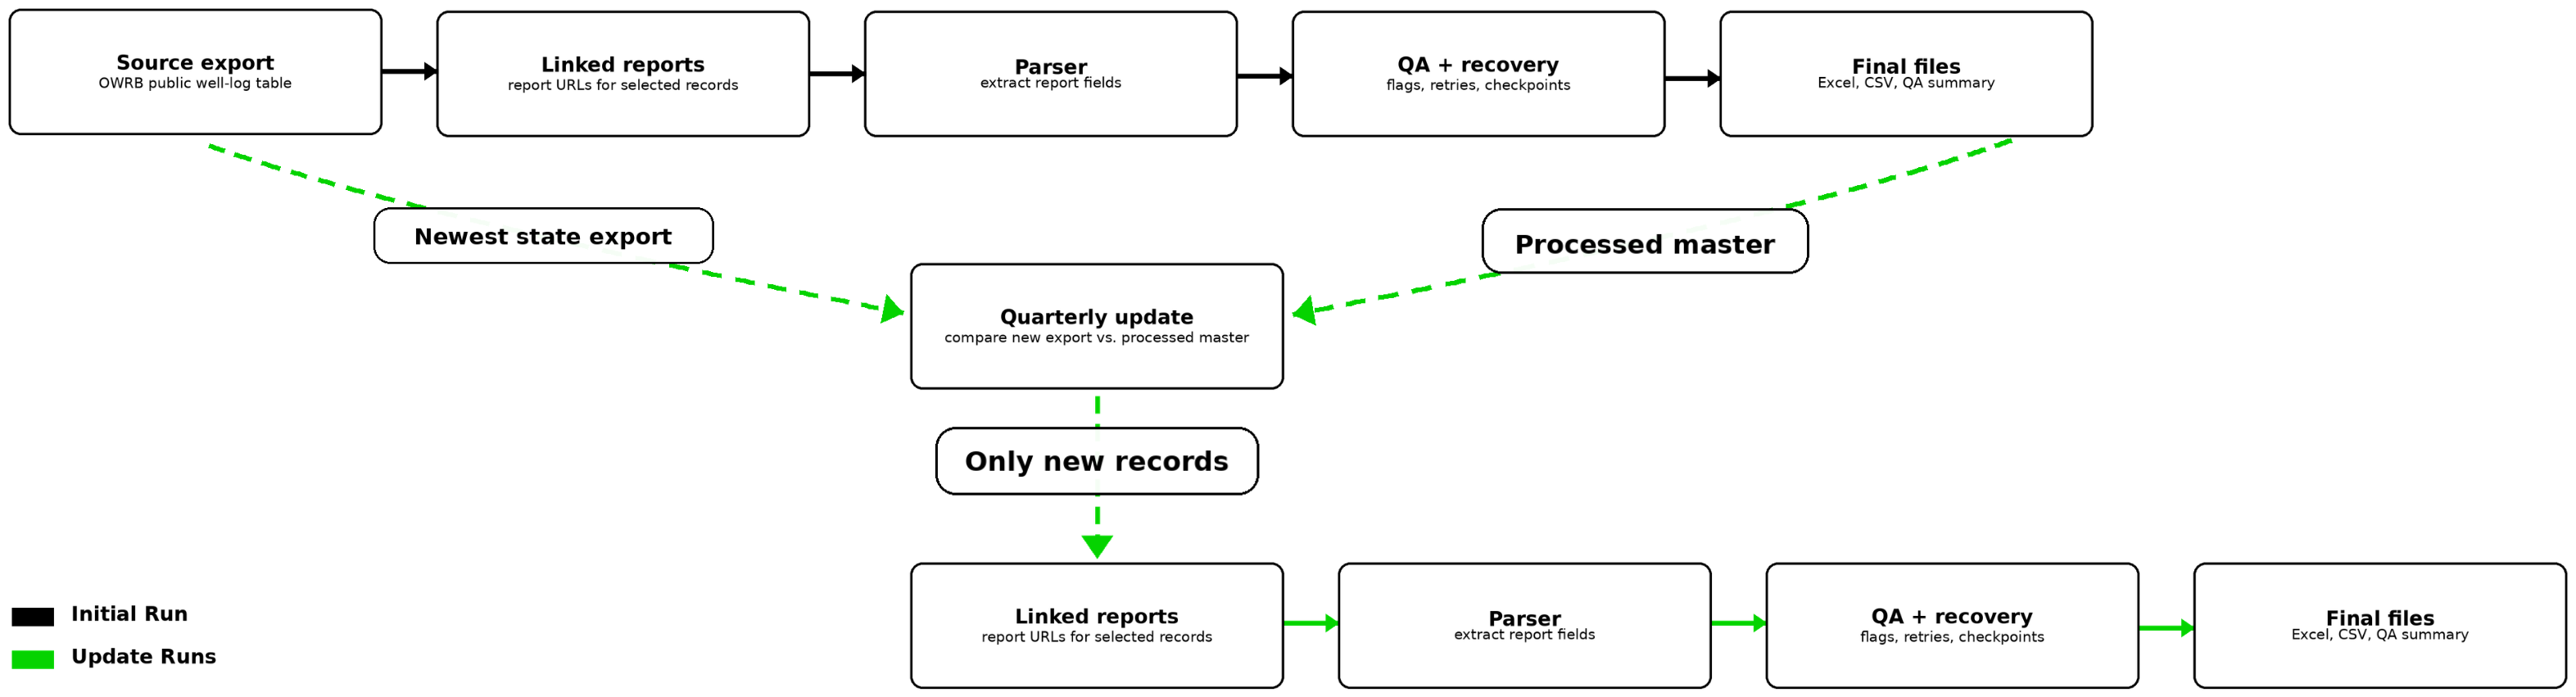
I created a Python/Jupyter workflow that:
- loads and filters the public well-log export
- collects site IDs and report URLs
- downloads and caches each linked report
- parses variations in the report layout
- extracts screen/perforation, plugging, and drawdown values
- flags records that need review
- retries failed requests
- exports client-ready Excel and CSV files
- identifies only new records during quarterly updates
The final files were structured for use in the client’s mapping and modeling workflow, with the original report URLs retained for traceability.
What Made the Work Difficult
The source material was not a clean table. The values I needed were spread across thousands of public reports with layout differences from record to record.
The parser had to account for:
- values stored in HTML tables as well as flattened text
- blank cells that changed how nearby values lined up
- wells with multiple screen or perforation intervals
- reports containing more than one drawdown reading
- request timeouts and dropped connections from the public website
- Excel constraints when storing more than 144,000 clickable report links
I handled those issues with local caching, paced requests, retries, checkpoints, extraction notes, and QA flags.
Quality Checks
Each run produced QA outputs alongside the client-facing files. These recorded whether a report loaded, which sections were present, what values were extracted, whether the parser found anything questionable, and whether processing raised an error.
One useful check flagged reports that appeared to contain a target section but returned no extracted value. I used those flagged rows to improve the parser and rerun validation. In the completed full run, no suspicious rows remained.
Final Run Summary
| Metric | Result |
|---|---|
| Rows processed | 144,644 |
| Reports loaded | 144,644 |
| Reports failed | 0 |
| Records with screen/perforation data | 91,535 |
| Records with plugging data | 10,032 |
| Records with drawdown data | 14,555 |
| Suspicious rows | 0 |
| Rows with errors | 0 |
| Failed/error rows | 0 |
Deliverables
The final delivery included the original source export, working notebooks, client-ready output files, and QA/review files.
Download project files
These files document the full Oklahoma well-log extraction workflow: source data, Jupyter notebooks, final outputs, and QA artifacts.
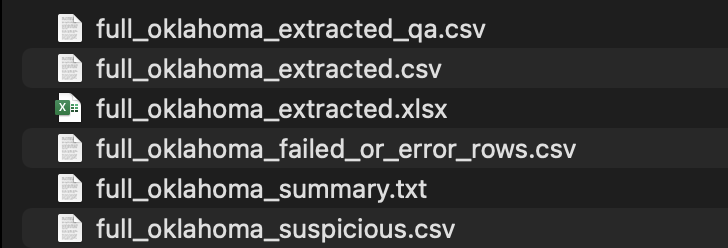
- clean Excel and CSV output files
- a QA file covering load status and extraction results
- a suspicious-row review file
- a failed/error-row file
- a run summary
- a quarterly update workflow for newly published records

Quarterly Updates
The initial run processed the full set of public reports. For recurring updates, I built a second workflow that loads the newest state export, compares its site IDs with the processed master file, and runs extraction only for records that have not been handled before.
That keeps quarterly updates smaller and faster while preserving the same QA trail as the original run.
Tools Used
Python, Jupyter Notebook, pandas, requests, BeautifulSoup, openpyxl, regular expressions, local caching, retries, checkpoints, and QA flagging.
Why This Project Matters
This was a data extraction problem at practical scale: useful values existed in public records, but not in a form the client could analyze directly. The pipeline turned those reports into structured files that could be mapped, reviewed, and refreshed when new records became available.
What I Would Change Next Time
The project delivered the final dataset, but the full run showed where the workflow could be stronger.
1. Move Out of Jupyter Earlier
Jupyter was useful for exploring report layouts and testing parser rules. Once extraction stabilized, I chould have moved the workflow into Python scripts for cleaner logging, recovery, version control, and quarterly updates.
2. Run Independent Batches
The sequential extraction took about two days. Next time, I would split the
dataset into independent batches that could run at the same time, reducing the
total runtime while keeping separate QA and failure outputs for validation. I
would still pace requests conservatively to avoid putting unnecessary load on
the public website.
Example:
batch_001: rows 0–25,000
batch_002: rows 25,001–50,000
batch_003: rows 50,001–75,000
…
3. Build Recovery In From the Start
Caching, retries, and checkpoints became essential as the project scaled. I would design these in from the beginning so interrupted runs could resume cleanly and retry only unfinished or failed records.
4. Separate Final and Internal Files
I would keep client deliverables separate from QA files, logs, checkpoints, and pilot outputs. That would make handoff cleaner and reduce the risk of sharing the wrong file.
5. Track Performance
I would log runtime, records processed per hour, cache hits, retries, and failures. Those metrics would make future runs easier to estimate and explain.
The extraction worked. A second version would package the same approach as a more organized, restartable batch pipeline.